✨ Verified 2026/27 Tax Thresholds · Audited across 22 Official Government Revenue Databases

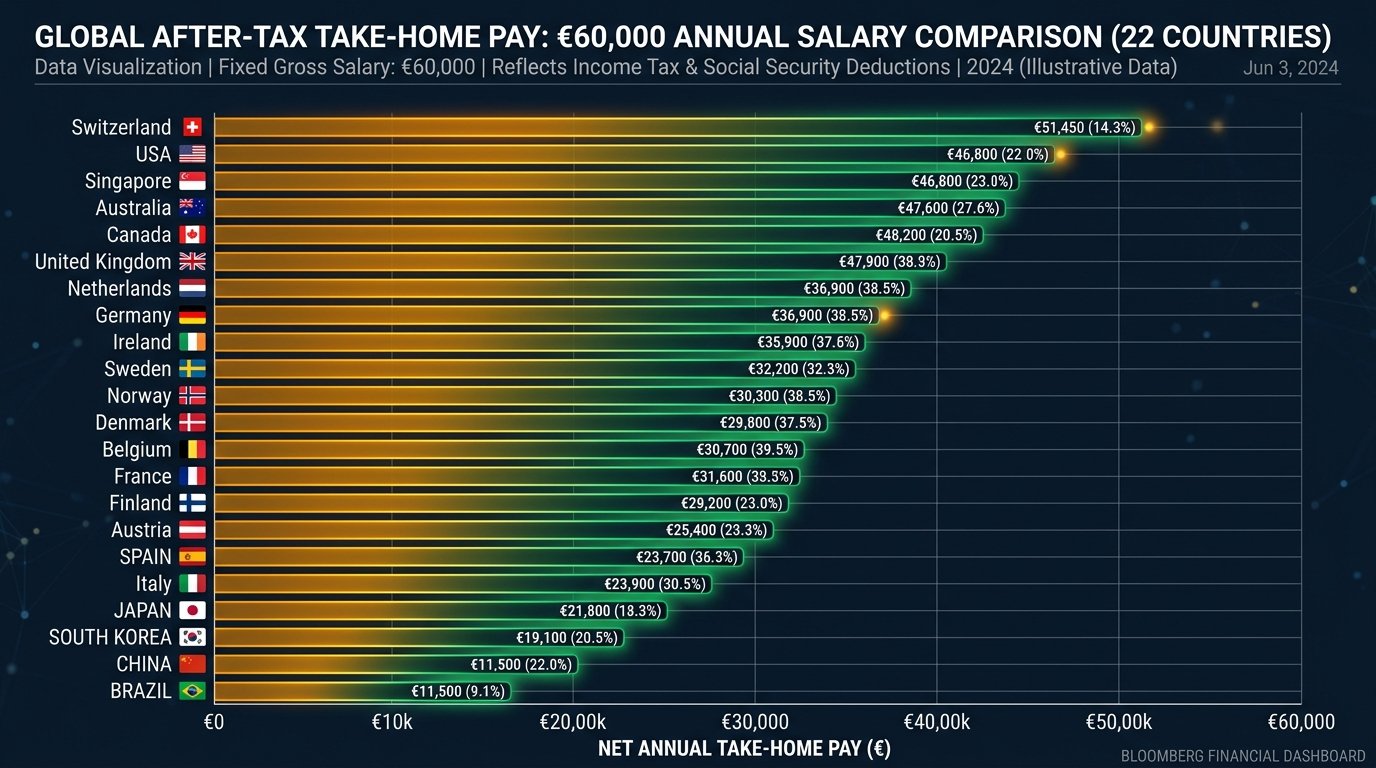
We converted the same €60,000 salary into 22 currencies and ran it through 22 tax systems — every calculator on this site, one identical worker. The spread is over €1,000 a month between top and bottom. The rankings will bruise some national stereotypes, starting with the Nordic one.
€60,000 is a useful test salary: a solid professional income in every country we cover — senior enough that real tax bands bite, ordinary enough that no exotic top-rate rules distort the picture. One imaginary worker: single, no children, standard credits, no pension top-ups or special regimes. Same money, 22 rulebooks.
| # | Country | Local equivalent of €60,000 | Net per month (local) | ≈ €/month | % kept |
|---|---|---|---|---|---|
| 1 | United States* | $69,600 | $4,792 | €4,131 | 82.6% |
| 2 | Canada* | C$96,000 | C$6,474 | €4,046 | 80.9% |
| 3 | United Kingdom | £51,600 | £3,374 | €3,923 | 78.5% |
| 4 | Singapore†| S$90,000 | S$5,765 | €3,843 | 76.9% |
| 5 | Israel | ₪228,000 | ₪14,587 | €3,839 | 76.8% |
| 6 | Australia | A$106,200 | A$6,786 | €3,834 | 76.7% |
| 7 | Ireland | €60,000 | €3,761 | €3,761 | 75.2% |
| 8 | Switzerland‡ | CHF 55,800 | CHF 3,459 | €3,719 | 74.4% |
| 9 | New Zealand | NZ$117,000 | NZ$7,140 | €3,662 | 73.2% |
| 10 | Netherlands | €60,000 | €3,598 | €3,598 | 72.0% |
| 11 | Japan | ¥10,560,000 | ¥616,252 | €3,501 | 70.0% |
| 12 | Spain | €60,000 | €3,469 | €3,469 | 69.4% |
| 13 | Luxembourg | €60,000 | €3,431 | €3,431 | 68.6% |
| 14 | Norway | kr 702,000 | kr 39,269 | €3,356 | 67.1% |
| 15 | Finland | €60,000 | €3,339 | €3,339 | 66.8% |
| 16 | Sweden | kr 660,000 | kr 36,155 | €3,287 | 65.7% |
| 17 | Denmark | kr 447,600 | kr 24,111 | €3,232 | 64.6% |
| 18 | Austria§ | €60,000 | €3,131 | €3,131 | 62.6% |
| 19 | France | €60,000 | €3,120 | €3,120 | 62.4% |
| 20 | Italy | €60,000 | €3,111 | €3,111 | 62.2% |
| 21 | Germany | €60,000 | €3,082 | €3,082 | 61.6% |
| 22 | Belgium | €60,000 | €3,071 | €3,071 | 61.4% |
* Federal tax only — most US states and all Canadian provinces add their own income tax, typically pulling both countries several places down this list. Texas or Florida keep the ranking as shown. †Singapore's deduction is mostly CPF — compulsory savings that stay yours; Employment Pass holders skip it entirely. ‡ Average cantonal rate; Swiss residents also buy mandatory health insurance (CHF 300–450/month) separately. § Austrian pay arrives in 14 instalments; figure annualised. Currency conversions at approximate mid-market rates, July 2026 (1 EUR = 0.86 GBP, 1.16 USD, 1.60 CAD, 1.77 AUD, 1.95 NZD, 0.93 CHF, 7.46 DKK, 11.0 SEK, 11.7 NOK, 176 JPY, 1.50 SGD, 3.80 ILS).
Ask anyone to guess the bottom of this table and they'll name a Nordic country. They'd be wrong by four places or more. Norway keeps 67.1% of our test salary, Finland 66.8%, Sweden 65.7%, Denmark 64.6% — every one of them ahead of Austria, France, Italy, Germany and Belgium. The heaviest payslips in this comparison belong not to Scandinavia but to the Western European social-insurance belt, where pension, health and unemployment contributions stack on top of income tax and only Germany caps them meaningfully.
The Nordic reputation comes from somewhere real: top marginal rates arrive early and steep, VAT is high, and in Denmark's case the car taxes are legendary. But at €60,000 — a good but ordinary professional salary — the Nordic middle class is taxed more gently than the German one. The stereotype is about where the pain sits on the income curve, not how much of this particular salary survives.
The US and Canada top the ranking with an asterisk doing heavy lifting: add California's state tax or Ontario's provincial tax and both drop toward the middle of the pack. More fundamentally, the light-payslip countries bill separately for things the heavy-payslip countries bundle in. An American's €4,131 has health insurance premiums, deductibles and retirement savings still to come out of it; a Belgian's €3,071 arrives with healthcare, a state pension entitlement and some of Europe's strongest unemployment insurance already paid for. The table measures what hits the account — not what's left after life's non-negotiables.
Singapore deserves its own footnote in bold: 20 percentage points of its "deduction" is CPF, compulsory savings deposited into accounts the worker owns for retirement, housing and healthcare. Treat CPF as deferred salary rather than tax and Singapore effectively keeps ~95% — which is why it functions as the control group of world tax systems.
One single worker, no children, standard credits and allowances only, no pension contributions, no expat regimes (the Dutch 30% ruling, Spain's Beckham law and Italy's impatriati would all move their countries up for qualifying newcomers). €60,000 converted at the rounded mid-market rates listed under the table, then run through each country's 2026 rules exactly as our 22 national calculators compute them — every number here is reproducible by typing the local gross into the corresponding calculator. Cost of living is deliberately out of scope: this is a tax comparison, not a where-to-live verdict.
Curious what moving would do to your own number? Our moving abroad calculator runs this exact exercise for any salary and any pair of these countries.
Journalists and researchers: you're welcome to cite these figures with a link. For custom cuts of this data — different salary levels, country subsets, family scenarios — get in touch; we're happy to run them.
Need custom deductions, pension contributions, or local tax calculations?
Open Interactive Calculator →Subscribe for annual tax bracket changes, expat guides, and salary insights across 22 countries.